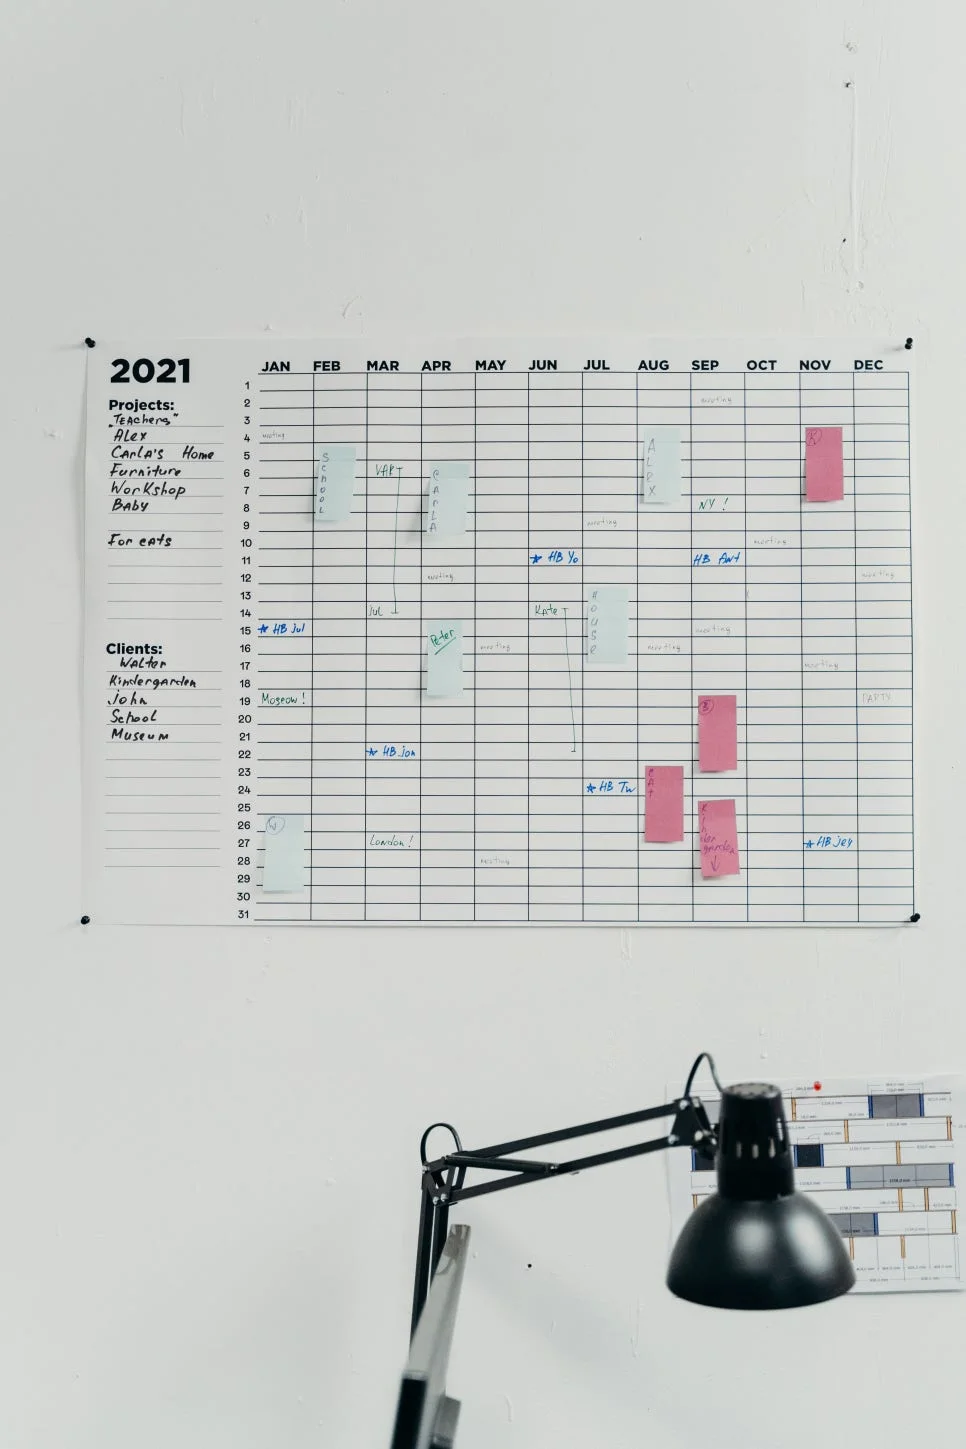
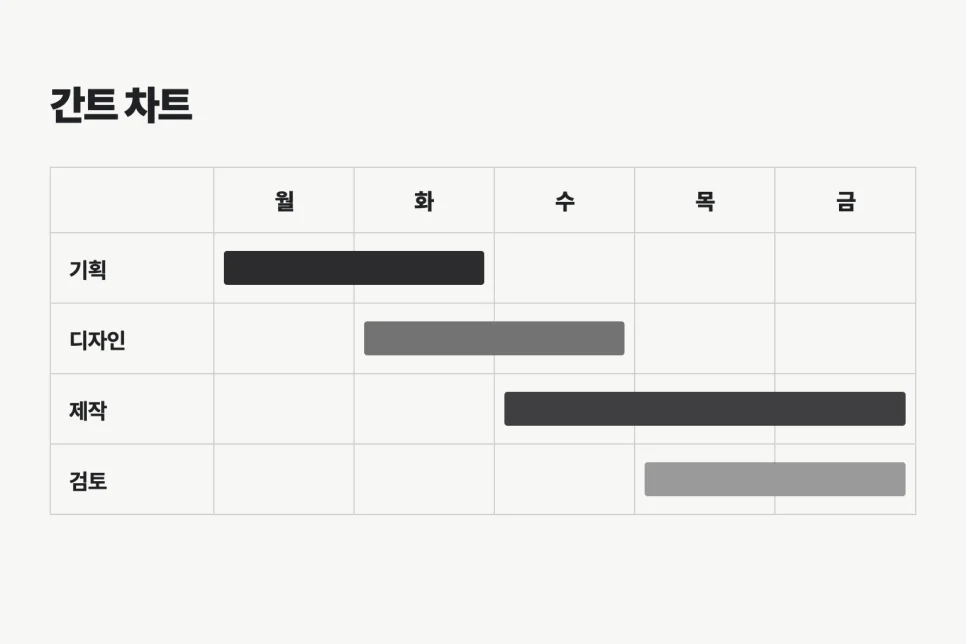
List the work, then show its start and finish as a bar. That is the basic idea behind a Gantt chart.
The name may sound technical, but the idea is simple. Place tasks and their durations on one timeline to see sequence, overlap, and busy periods.
Three Questions a Gantt Chart Answers
A task list shows what comes next, but not how long each task takes or which tasks can run at the same time. Duration bars make those relationships visible.
- When does it start?
- How long does it take?
- Does it overlap with other work?
The ILJI Timeline Also Uses Time Blocks
A traditional Gantt chart moves from left to right. ILJI’s daily timeline moves from top to bottom, while using the same principle: position and length represent start time and duration.
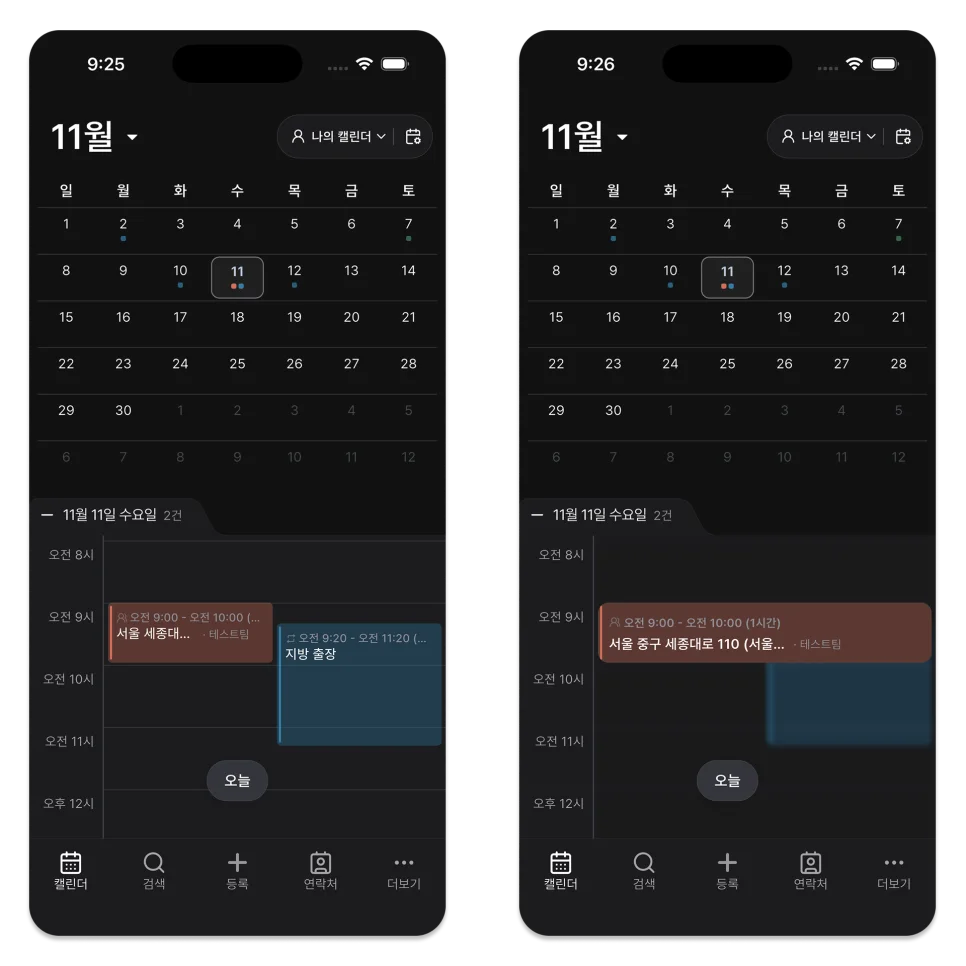
A 2:00–3:00 visit and a 2:30–3:30 consultation require mental comparison in a list. On the timeline, side-by-side blocks reveal the 30-minute overlap and the open time before the next appointment.
A Kanban Board Shows Status
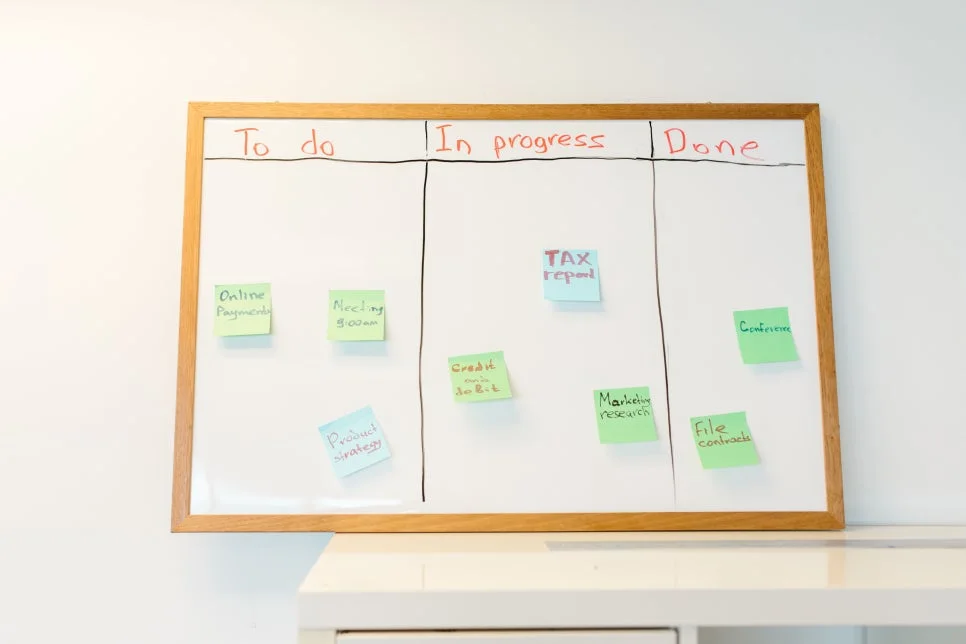
A Kanban board turns work into cards and moves each card through stages such as To Do, In Progress, and Done. A Gantt chart emphasizes timing and duration; Kanban emphasizes current status.
Why Time and Status Belong Together
ILJI does not provide a separate Gantt or Kanban board. Its daily timeline shows time and overlap in blocks, while completed and canceled schedules remain distinguishable. In progress refers to an active service timer rather than a general schedule status.
Do more than count appointments. Check when they start, how long they take, and what they overlap.